


Breast cancer is a heterogeneous disease with varied clinical outcomes, and gene expression profiling gives insight into the molecular pathways behind its aggressiveness and progression.
The data used here come from a study of the molecular basis of histologic grade in breast cancer. From that dataset we focus on a single gene, KPNA2, which encodes Karyopherin Subunit Alpha 2, a protein involved in nuclear transport. KPNA2 has been identified as a potential biomarker in breast cancer due to its association with poor prognosis and its role in various cellular processes that are critical for tumorigenesis, such as cell proliferation, differentiation, and DNA repair. Elevated levels of KPNA2 have been observed in more aggressive cancers and correlate with adverse clinical outcomes, including higher tumor grade and lymph node involvement.
The dataset used here includes KPNA2 gene expression measurements from breast cancer patients, along with clinical data on histologic grade, lymph node status, tumor size and patient age. Histologic grade categorizes tumor cells based on their appearance and organization, providing a measure of tumor aggressiveness. Lymph node status indicates whether the axillary lymph nodes were free of tumor cells (coded as 0, node-negative) or contained metastatic tumor cells (coded as 1, node-positive), which is a standard indicator of how far the tumor has spread.
In this analysis, we use multiple regression to examine how well histologic grade, lymph node status and tumor size together explain KPNA2 expression.
Read data
We begin by reading the dataset and displaying its first rows.
Notebook Cell
# When the page runs in the browser (JupyterLite), we install seaborn, and let Python download files through the browser
import sys
if sys.platform == "emscripten":
    import micropip
    await micropip.install(["seaborn", "pyodide-http"])
    import pyodide_http
    pyodide_http.patch_all()
import pandas as pd
import numpy as np
import matplotlib.pyplot as plt
import seaborn as sns
from sklearn.linear_model import LinearRegression
# Load the data from a local copy, or download it and save a local copy on first use
try:
gene_table = pd.read_csv('brc.txt', index_col=0)
except FileNotFoundError:
from urllib.request import urlopen
url = 'https://raw.githubusercontent.com/statOmics/statisticalGenomicsCourse/master/tutorial1/gse2990BreastcancerOneGene.txt'
gene_table = pd.read_table(urlopen(url), sep=" ")
gene_table.to_csv('brc.txt')
# Show the first rows
gene_table.head()We add a column with the (natural) logarithm of the KPNA2 gene expression value.
# Log-transform the KPNA2 gene expression values
gene_table["log_gene"] = np.log(gene_table["gene"])
gene_table.head()Subsequently, we plot the logged gene expression as a function of node status and tumor grade.
# Visualize KPNA2 expression by histologic grade and lymph node status
plt.figure(figsize=(10, 6))
sns.boxplot(x='grade', y='log_gene', hue='node', data=gene_table)
plt.xlabel('Histologic Grade')
plt.ylabel('Log-transformed KPNA2 Expression')
plt.legend(title='Lymph Node Status')
plt.show()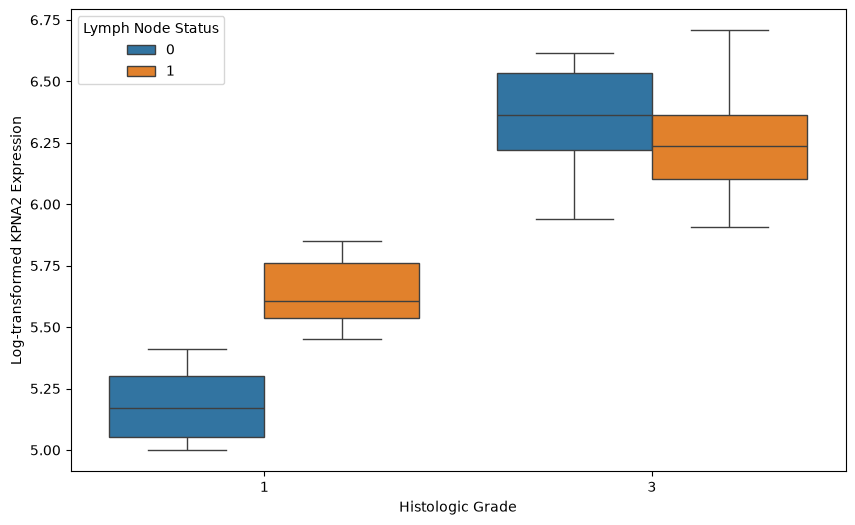
We then fit two models of the logged gene expression: one with tumor size as the only predictor, and one with grade, node status and size. As a first check, we plot the residuals of each model.
# Perform two regressions: one with only 'size' and another with 'grade', 'node', and 'size'

# Regression with only 'size' as the independent variable
y = gene_table['log_gene']
X_size = gene_table[['size']]
model_size = LinearRegression()
model_size.fit(X_size, y)
gene_table['predicted_log_gene_size'] = model_size.predict(X_size)

# Regression with 'grade', 'node', and 'size' as independent variables
X_all = gene_table[['grade', 'node', 'size']]
model_all = LinearRegression()
model_all.fit(X_all, y)
gene_table['predicted_log_gene_all'] = model_all.predict(X_all)

# Calculate residuals for both regression models

# Residuals for model with only 'size' as the independent variable
gene_table['residuals_size'] = gene_table['log_gene'] - gene_table['predicted_log_gene_size']

# Residuals for model with 'grade', 'node', and 'size' as independent variables
gene_table['residuals_all'] = gene_table['log_gene'] - gene_table['predicted_log_gene_all']

# Plot the residuals for both models
plt.figure(figsize=(12, 6))

# Residuals for size-only model
plt.subplot(1, 2, 1)
plt.scatter(gene_table['size'], gene_table['residuals_size'], color='blue', alpha=0.5)
plt.axhline(0, color='red', linestyle='--', linewidth=1)
plt.xlabel('Tumor Size')
plt.ylabel('Residuals')
plt.ylim(-1,1)
plt.title('Residuals (Size-Only Model)')
plt.grid(True)

# Residuals for full model with grade, node, and size
plt.subplot(1, 2, 2)
plt.scatter(gene_table['size'], gene_table['residuals_all'], color='green', alpha=0.5)
plt.axhline(0, color='red', linestyle='--', linewidth=1)
plt.xlabel('Tumor Size')
plt.ylabel('Residuals')
plt.ylim(-1,1)
plt.title('Residuals (Full Model: Grade, Node, Size)')
plt.grid(True)

plt.tight_layout()
plt.show()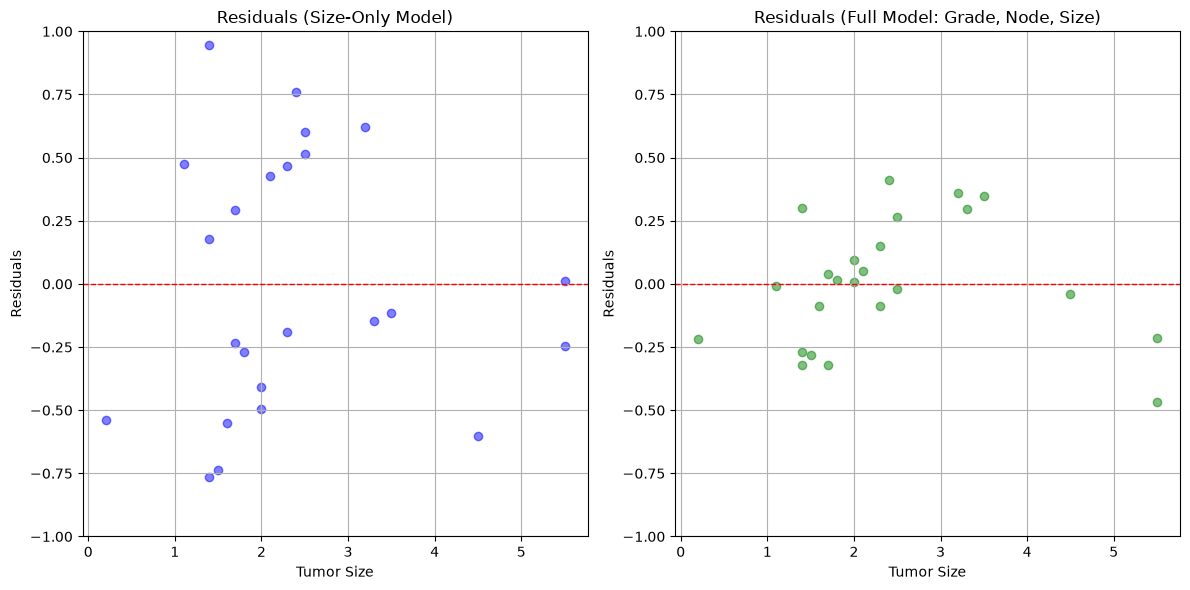
The residuals are smaller for the full model than for the model based only on tumor size. We also plot the predicted against the actual values.
# Scatterplots of actual vs predicted log_gene values for both models

plt.figure(figsize=(12, 6))

# Scatterplot for size-only model predictions
plt.subplot(1, 2, 1)
plt.scatter(gene_table['log_gene'], gene_table['predicted_log_gene_size'], color='blue', alpha=0.5)
plt.plot([gene_table['log_gene'].min(), gene_table['log_gene'].max()],
         [gene_table['log_gene'].min(), gene_table['log_gene'].max()],
         'r--', linewidth=1)  # Line y=x for reference
plt.xlabel('Actual Log-transformed KPNA2 Expression')
plt.ylabel('Predicted Log-transformed KPNA2 (Size Only)')
plt.title('Actual vs Predicted (Size Only Model)')
plt.grid(True)

# Scatterplot for full model predictions
plt.subplot(1, 2, 2)
plt.scatter(gene_table['log_gene'], gene_table['predicted_log_gene_all'], color='green', alpha=0.5)
plt.plot([gene_table['log_gene'].min(), gene_table['log_gene'].max()],
         [gene_table['log_gene'].min(), gene_table['log_gene'].max()],
         'r--', linewidth=1)  # Line y=x for reference
plt.xlabel('Actual Log-transformed KPNA2 Expression')
plt.ylabel('Predicted Log-transformed KPNA2 (Grade, Node, Size)')
plt.title('Actual vs Predicted (Full Model: Grade, Node, Size)')
plt.grid(True)

plt.tight_layout()
plt.show()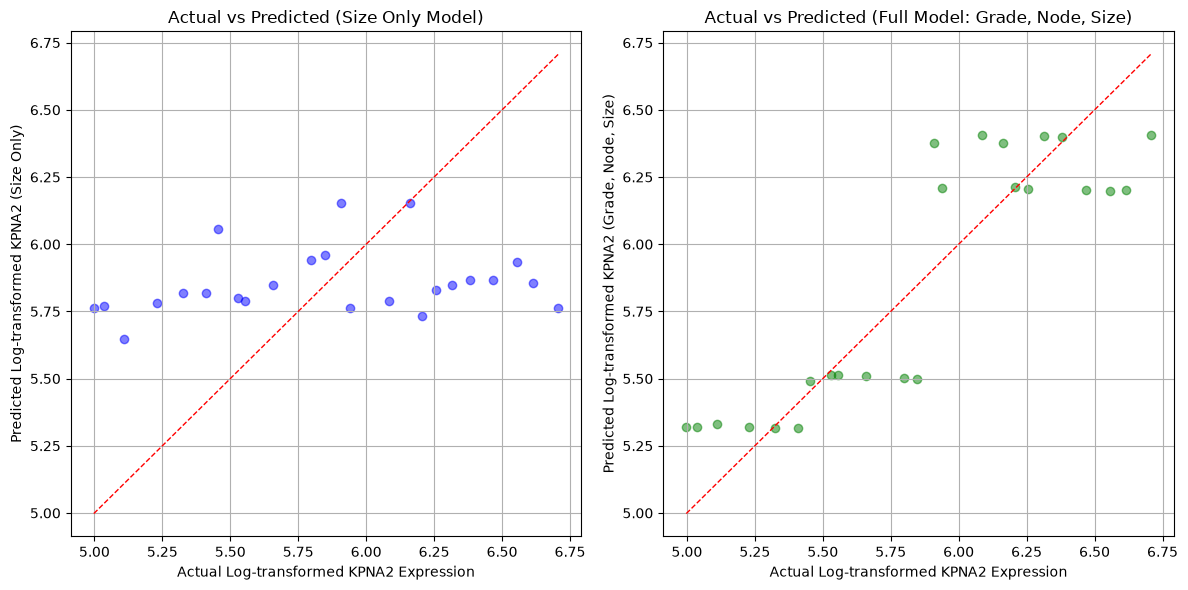
What you should know after reading this chapter
You should be able to:
Set up a multiple regression where clinical variables (tumor grade, lymph-node status and tumor size) together explain the expression of a gene.
Use residual plots and plots of predicted against actual values to compare two models of the same response, such as a size-only model against a model with grade, node status and size.
- Sotiriou, C., Wirapati, P., Loi, S., Harris, A., Fox, S., Smeds, J., Nordgren, H., Farmer, P., Praz, V., Haibe-Kains, B., Desmedt, C., Larsimont, D., Cardoso, F., Peterse, H., Nuyten, D., Buyse, M., Van de Vijver, M. J., Bergh, J., Piccart, M., & Delorenzi, M. (2006). Gene Expression Profiling in Breast Cancer: Understanding the Molecular Basis of Histologic Grade To Improve Prognosis. JNCI: Journal of the National Cancer Institute, 98(4), 262–272. 10.1093/jnci/djj052