


Linear algebra
Row Vector
A row vector is a 1-dimensional array consisting of a single row of elements. For example, a row vector with three elements can be written as:
Column Vector
A column vector is a 1-dimensional array consisting of a single column of elements. It can be thought of as a matrix with one column. For instance, a column vector with three elements appears as:
Matrix
A matrix is a rectangular array of numbers arranged in rows and columns. For example, a matrix with two rows and three columns is shown as:
Transpose Operator
The transpose of a matrix is obtained by swapping its rows with its columns. The transpose of matrix is denoted . For the given matrix , the transpose is:
Multiplication between Vectors
Vector multiplication can result in either a scalar or a matrix:
Dot product: Multiplication of the transpose of a column vector with another column vector results in a scalar. This is also known as the inner product:
Outer product: The multiplication of a column vector by the transpose of another column vector results in a matrix:
Matrix Multiplication
The product of an matrix and a matrix is an matrix ; the number of columns of has to equal the number of rows of . Each element of is computed as the dot product of the -th row of and the -th column of :
L2-norm (Euclidean norm)
The L2-norm of a vector (also called the Euclidean norm) measures its length and is defined as:
Projection
The projection of vector onto vector is given by:
This represents the orthogonal projection of in the direction of .
Source
import numpy as np
import matplotlib.pyplot as plt

u = np.array([1, 3])
v = np.array([3, 1])

# Projection of u onto v, and the component of u orthogonal to v
proj_u_on_v = np.dot(u, v) / np.dot(v, v) * v
orthogonal_component = u - proj_u_on_v

# Plot u, v and the projection of u onto v
plt.figure(figsize=(6, 6))
plt.quiver(0, 0, u[0], u[1], angles='xy', scale_units='xy', scale=1, color='r', label=r'$\mathbf{u}=(1,3)^T$')
plt.quiver(0, 0, v[0], v[1], angles='xy', scale_units='xy', scale=1, color='b', label=r'$\mathbf{v}=(3,1)^T$')
plt.quiver(0, 0, proj_u_on_v[0], proj_u_on_v[1], angles='xy', scale_units='xy', scale=1, color='g', label=r'proj$_{\mathbf{v}} \mathbf{u}$')

# Plot orthogonal line as a dotted line segment
end_point = proj_u_on_v + orthogonal_component
plt.plot([proj_u_on_v[0], end_point[0]], [proj_u_on_v[1], end_point[1]], 'purple', linestyle='dotted', label='Orthogonal Component')

# Set plot limits and aspect
plt.xlim(0, 4)
plt.ylim(0, 4)
plt.gca().set_aspect('equal', adjustable='box')

# Add a grid, legend, and labels
plt.grid(True)
plt.legend()
plt.title(r'Projection of Vector $\mathbf{u}$ onto Vector $\mathbf{v}$')
plt.xlabel('X axis')
plt.ylabel('Y axis')
plt.show()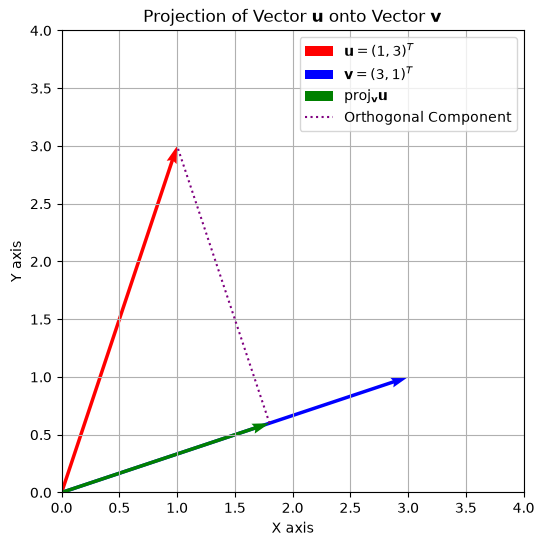
Eigenvalue and Eigenvector
An eigenvalue and its corresponding eigenvector of a square matrix satisfy the equation:
Gradient
The gradient of a multivariable function is a vector of partial derivatives, which points in the direction of the steepest ascent of :
Basics of Probability
Descriptive Statistics
Mean
The mean of a set of numbers is the average of all the values. For a set , the sample mean is calculated as:
Variance
The variance measures the spread of a set of numbers around their mean. For a sample with sample mean , the maximum likelihood estimate of the variance (assuming normally distributed data) is
Because the same data are used to estimate the mean, this estimate is biased (it tends to underestimate the variance). Dividing by instead (Bessel’s correction) gives the unbiased estimate
Covariance
Covariance is a measure of how much two random variables change together. For paired samples and of the variables and , with sample means and , the maximum likelihood estimate of the covariance is
while the unbiased estimate uses :
Probability Distributions
Probability Density Function (PDF)
The probability density function (pdf) of a continuous random variable is a function that describes how densely the probability is concentrated around each value of the random variable; the probability of any single exact value is zero. The area under the pdf curve between two values represents the probability of the variable falling within that range. A discrete random variable is instead described by its probabilities of taking each value .
Cumulative Distribution Function (CDF)
The cumulative distribution function (cdf) of a random variable gives the probability that will take a value less than or equal to . It is defined as:
Uniform Distribution
The uniform distribution is a probability distribution where every outcome is equally likely over a given interval . Its pdf is:
Normal Distribution
The normal distribution is a probability distribution that is symmetric about its mean , with values near the mean being more frequent than values far from it. With standard deviation , its pdf is given by:
Expectation Value
The expectation value of a random variable is the long-run average value of repetitions of the experiment it represents. For a discrete random variable it is given by the sum over its possible values, and for a continuous random variable with pdf by the corresponding integral:
Relationships Between Random Variables
Joint Probability Distributions
A joint probability distribution describes the probability (or density) of two or more random variables taking specific values together. For two variables and ,
denotes their joint distribution. From it, we can obtain the marginal distributions (see below) and conditional relationships such as
Marginal Probability Distributions
A marginal probability distribution gives the probability or density of a subset of variables, obtained by summing or integrating out the others from a joint distribution. For example, from a joint distribution of and :
This process is called marginalization. The resulting marginal describes the distribution of alone, regardless of . The marginal distribution of the data reappears below, as the denominator of Bayes’ theorem.
Probabilistic Inference
Likelihood
The likelihood function expresses how well different parameter values explain the observed data. For continuous data, it is written as and for discrete data as
Although the likelihood has the same mathematical form as a probability or density function, its interpretation differs: in the likelihood, the data are fixed and varies. The likelihood is not a probability distribution over ; its role is to compare parameter values in light of the data.
Maximum Likelihood
The maximum likelihood estimate (MLE) is the parameter value that maximizes the likelihood function:
It identifies the parameter that makes the observed data most probable (or most dense) under the model. MLEs are widely used because, under general conditions, they are consistent, asymptotically efficient, and asymptotically normal. In practice, the likelihood is often maximized numerically using gradient-based or expectation–maximization algorithms.
Prior Probability
The prior probability (or density ) represents our beliefs about parameter values before any data are observed. Priors can encode earlier experimental knowledge, theoretical limits, or subjective expectations. When little information is available, weakly informative or noninformative priors are used to prevent the prior from dominating the inference. In continuous models, the prior is a density satisfying ; in discrete models, it is a probability mass function summing to one.
Posterior Probability
After observing data , the prior is updated using Bayes’ theorem:
The resulting posterior distribution combines prior information with the information from the data through the likelihood. The denominator,
(or the corresponding sum for discrete variables) is the marginal distribution of the data, also called the marginal likelihood or evidence, and ensures that the posterior integrates or sums to one. The posterior forms the basis for Bayesian inference, from which we can compute summaries such as the posterior mean, variance, or mode.
What you should know after reading this chapter
You should be able to:
Calculate the transpose of a matrix, the dot product and the outer product of two vectors, and the product of two matrices using .
Calculate the L2-norm of a vector and the projection of one vector onto another.
Define an eigenvalue and eigenvector of a matrix through , and the gradient as the vector of partial derivatives that points in the direction of steepest ascent.
Calculate the mean, variance and covariance of a small dataset, and explain the difference between the maximum likelihood estimates (dividing by ) and the unbiased estimates (dividing by ).
Write down the pdfs of the uniform and normal distributions, explain how a pdf and a cdf give probabilities, and calculate the expectation value of a discrete random variable.
Calculate marginal and conditional probabilities from a joint distribution, by summing or integrating out the other variable.
Contrast a likelihood , where the data are fixed and varies, with a probability distribution over . Define the maximum likelihood estimate, and identify the prior, likelihood, posterior and evidence in Bayes’ theorem.